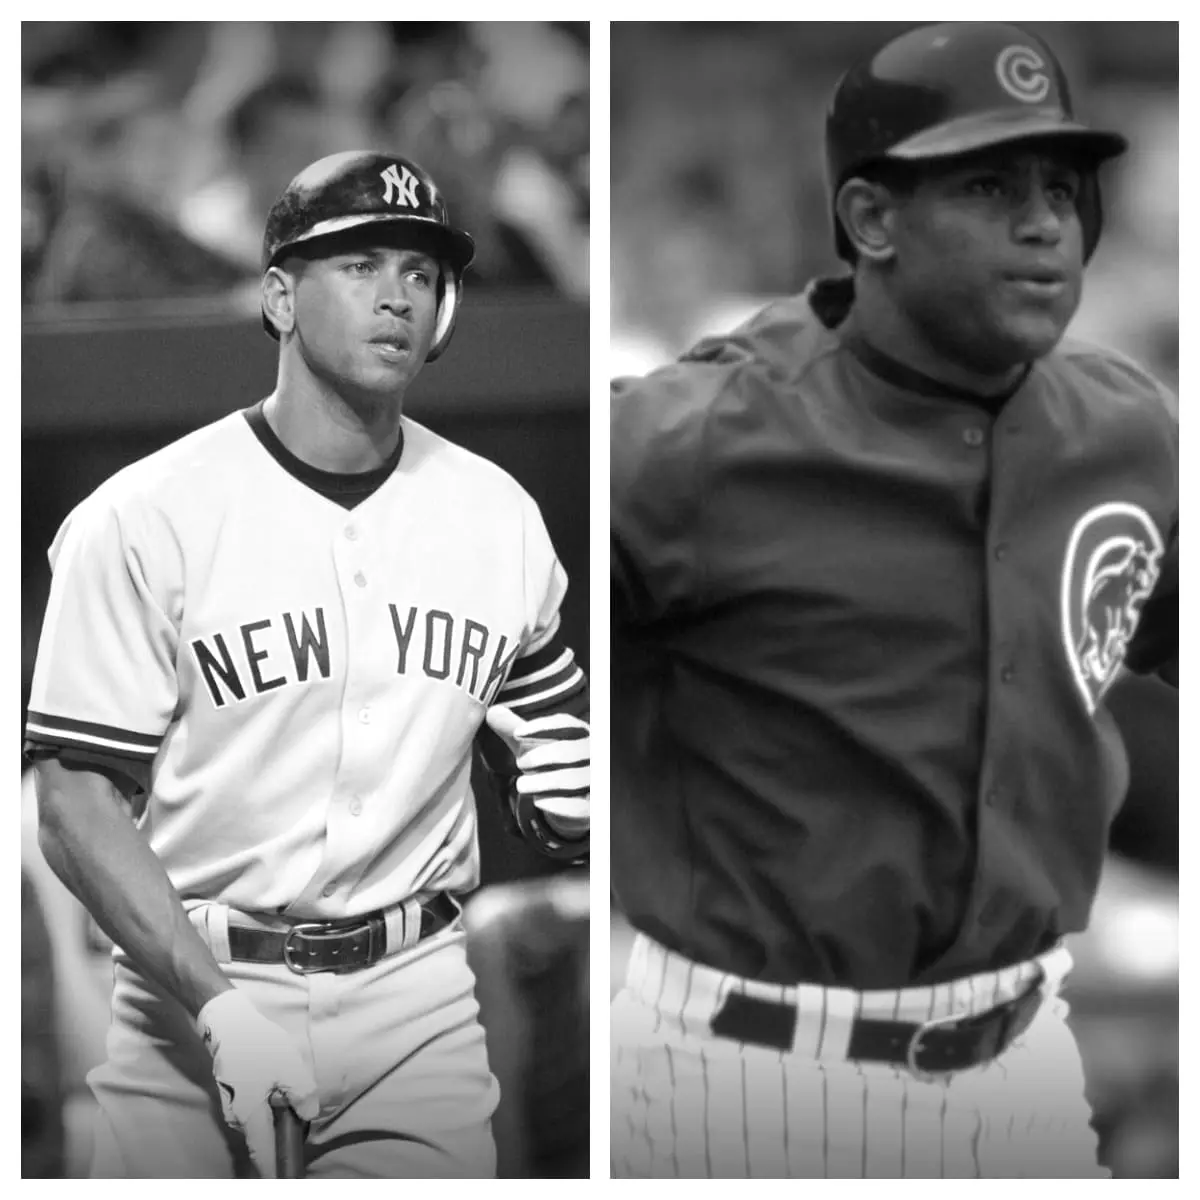
Rodriguez has an average at the plate of .295 for his career in baseball with 2,021 scored runs and an OPS of .315. He has gone down on strikes 2,287 times and earned a walk on 1,338 attempts at the plate, which contributes in part to a .380 on-base %. For his MLB career, Rodriguez has hit 696 baseballs out of the park while knocking in 2,086 runs. His slugging percentage is -.064 in addition to earning 5,813 bases. In his time in the Majors, he faced a pitcher 12,207 times and also came through with a base hit 3,115 times.
For the 8,813 at-bats in his career, Sosa has compiled an average at the plate of .273 in addition to having 2,408 base hits. He has homered 609 times, in addition to having 4,704 total bases and a -.073 slugging percentage. Sosa has drawn a free base 929 times while fanning on 2,306 tries. He has amassed 1,475 runs and also has 1,667 runs batted in. His on-base percentage is .344 and he is the owner of a career OPS of .270.
| Alex Rodriguez | Career | Sammy Sosa |
|---|---|---|
| 2,784 | Games Played | 2,354 |
| 12,207 | Plate Appearances | 9,896 |
| 10,566 | At-Bats | 8,813 |
| 2,021 | Runs | 1,475 |
| 3,115 | Hits | 2,408 |
| 548 | Doubles | 379 |
| 31 | Triples | 45 |
| 696 | Home Runs | 609 |
| 2,086 | Runs Batted In | 1,667 |
| 329 | Stolen Bases | 234 |
| 76 | Caught Stealing | 107 |
| 1,338 | Walks | 929 |
| 2,287 | Strikeouts | 2,306 |
| .295 | Batting Average | .273 |
| .380 | On-Base Percentage | .344 |
| -.064 | Slugging Percentage | -.073 |
| 0.315 | OPS | 0.270 |
| 5,813 | Total Bases | 4,704 |
| 261 | Grounded Into Double Plays | 202 |
| 176 | Hit By Pitch | 59 |