In the 106 games in his career, Mayfield has completed 2,157 of 3,395 attempts for a total of 24,832 yds. He averages 234.3 yds per game through the air. Mayfield has passed for 171 touchdowns while tossing 90 picks. He’s lost a combined 1,500 yds while being the victim of a QB sack 250 different times. His touchdown percentage is 5.0% and his interception percentage is 2.7%.
During the 69 contests in his career, Burrow has connected on 1,748 of his 2,547 attempts for 19,001 yards. He is averaging 275.4 yards per game through the air. Burrow has thrown for 140 touchdowns compared to 46 interceptions. He’s been driven back 1,176 yards while being the victim of a quarterback sack 196 different times. His TD percentage on pass attempts is 5.5% and his interception percentage is 1.8%.
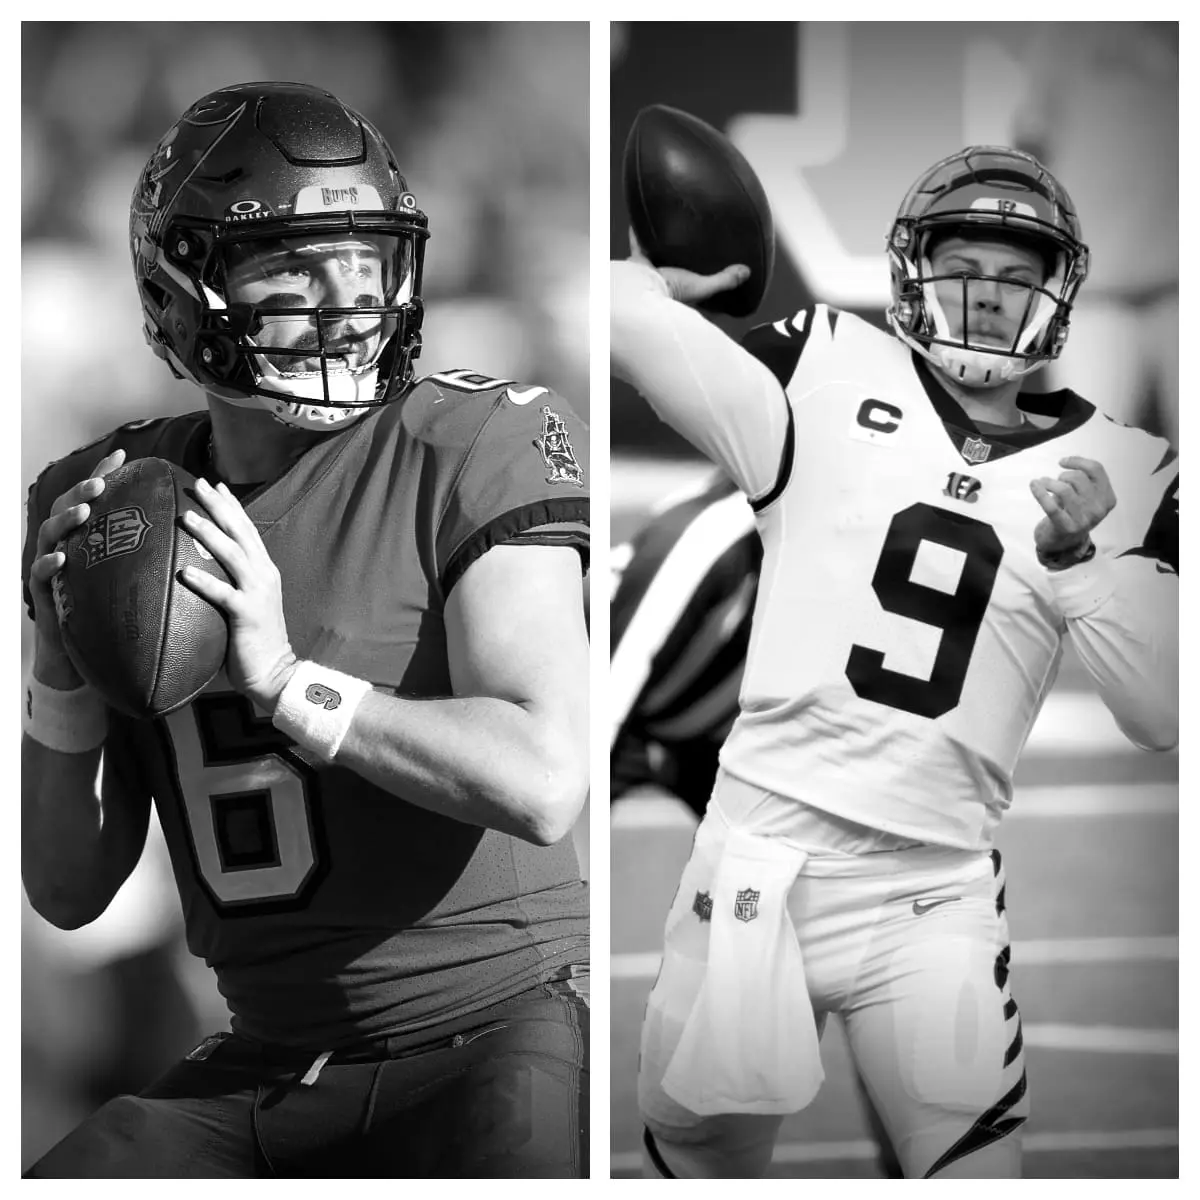
Baker Mayfield vs Joe Burrow Stats<-h2>
| Baker Mayfield<-th> | Career<-th> | Joe Burrow<-th><-tr><-thead> |
|---|---|---|
| 106<-td> | Games Played<-td> | 69<-td><-tr> |
| 2,157<-td> | Completions<-td> | 1,748<-td><-tr> |
| 3,395<-td> | Pass Attempts<-td> | 2,547<-td><-tr> |
| 63.5%<-td> | Completion %<-td> | 68.6%<-td><-tr> |
| 24,832<-td> | Passing Yards<-td> | 19,001<-td><-tr> |
| 171<-td> | Passing Touchdowns<-td> | 140<-td><-tr> |
| 5.0%<-td> | Touchdown Percentage<-td> | 5.5%<-td><-tr> |
| 90<-td> | Interceptions<-td> | 46<-td><-tr> |
| 2.7%<-td> | Interception Percentage<-td> | 1.8%<-td><-tr> |
| 7.3<-td> | Yards Per Pass Attempt<-td> | 7.5<-td><-tr> |
| 7.1<-td> | Adjusted Yards Per Pass Attempt<-td> | 7.7<-td><-tr> |
| 11.5<-td> | Yards Per Completion<-td> | 10.9<-td><-tr> |
| 234.3<-td> | Passing Yards Per Game<-td> | 275.4<-td><-tr> |
| 250<-td> | Times Sacked<-td> | 196<-td><-tr> |
| 7.4%<-td> | Sack Percentage<-td> | 7.7%<-td><-tr><-tr><-tbody><-table>Related |