During the 167 games in his career, McNabb connected on 3,170 of 5,374 attempts for a total of 37,276 yards. He averaged 223.2 yds per game through the air. McNabb passed for 234 touchdowns while tossing 117 interceptions. He lost a total of 2,460 yds while being the victim of a QB sack 410 different times. His touchdown percentage when attempting a pass was 4.4% and his interception rate was 2.2%.
During the 143 games in his career, Vick was successful on 1,807 of 3,217 tries for a total of 22,464 yards. He accumulated 157.1 yds per contest through the air. Vick threw for 133 TD’s compared to 88 interceptions. He lost a combined 1,896 yards while being sacked 316 times. His TD percentage when attempting a pass was 4.1% and his interception percentage was 2.7%.
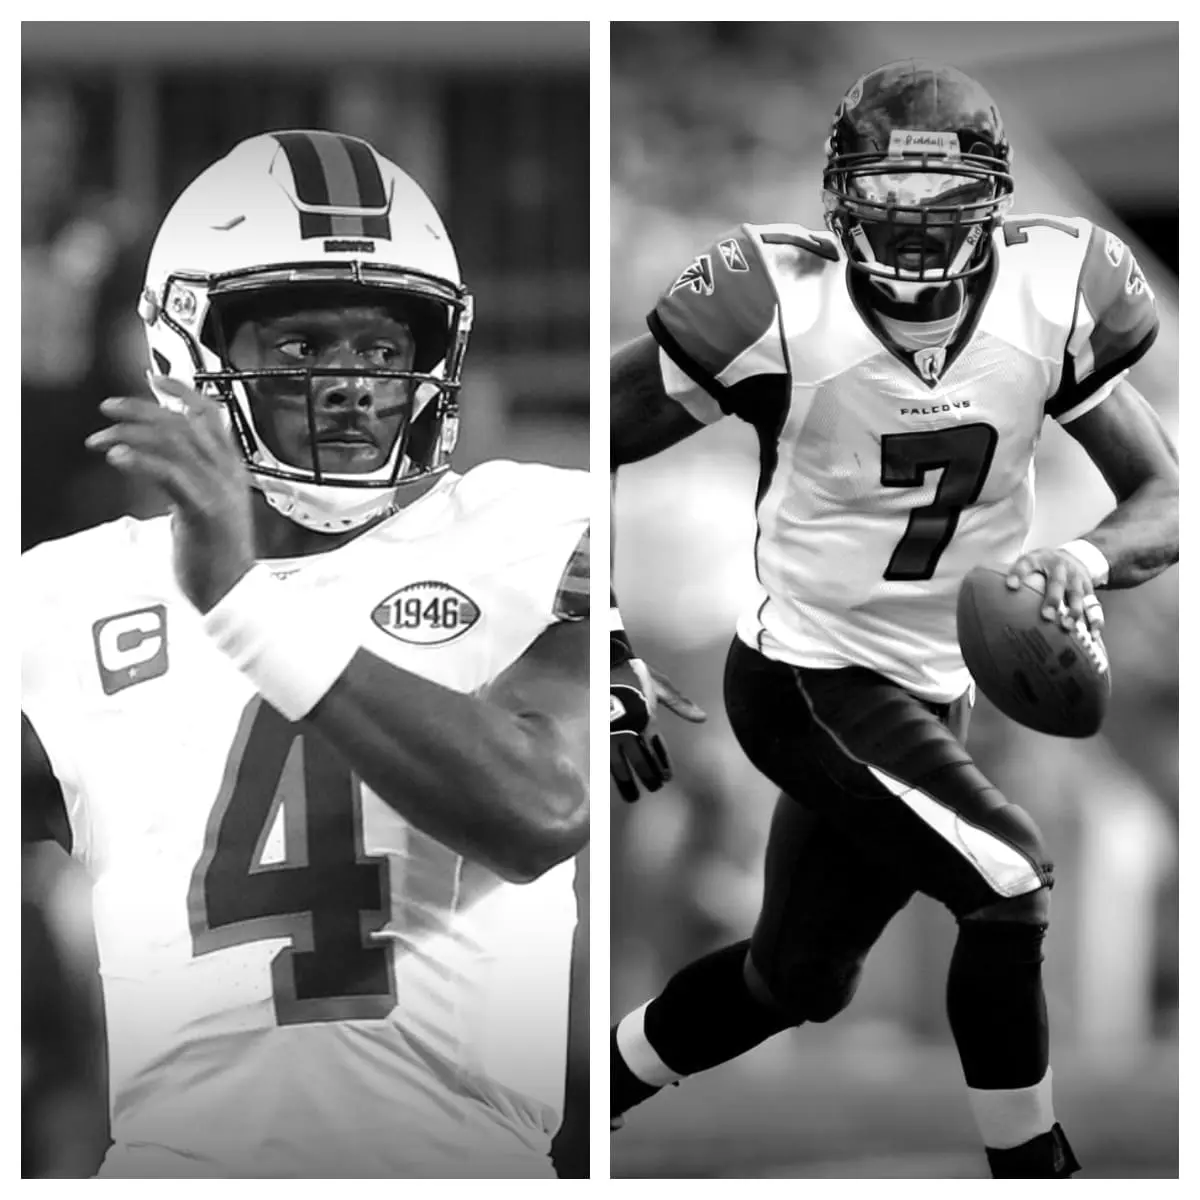
Donovan McNabb vs Michael Vick Stats<-h2>
| Donovan McNabb<-th> | Career<-th> | Michael Vick<-th><-tr><-thead> |
|---|---|---|
| 167<-td> | Games Played<-td> | 143<-td><-tr> |
| 3,170<-td> | Completions<-td> | 1,807<-td><-tr> |
| 5,374<-td> | Pass Attempts<-td> | 3,217<-td><-tr> |
| 59.0%<-td> | Completion %<-td> | 56.2%<-td><-tr> |
| 37,276<-td> | Passing Yards<-td> | 22,464<-td><-tr> |
| 234<-td> | Passing Touchdowns<-td> | 133<-td><-tr> |
| 4.4%<-td> | Touchdown Percentage<-td> | 4.1%<-td><-tr> |
| 117<-td> | Interceptions<-td> | 88<-td><-tr> |
| 2.2%<-td> | Interception Percentage<-td> | 2.7%<-td><-tr> |
| 6.9<-td> | Yards Per Pass Attempt<-td> | 7.0<-td><-tr> |
| 6.8<-td> | Adjusted Yards Per Pass Attempt<-td> | 6.6<-td><-tr> |
| 11.8<-td> | Yards Per Completion<-td> | 12.4<-td><-tr> |
| 223.2<-td> | Passing Yards Per Game<-td> | 157.1<-td><-tr> |
| 410<-td> | Times Sacked<-td> | 316<-td><-tr> |
| 7.6%<-td> | Sack Percentage<-td> | 9.8%<-td><-tr><-tr><-tbody><-table>
Related |