During the 167 contests in his career, McNabb was successful on 3,170 of 5,374 tries for 37,276 yds. He accumulated 223.2 passing yards per game. McNabb threw for 234 touchdowns while tossing 117 interceptions. He lost a combined 2,460 yds while being the victim of a quarterback sack 410 times. His touchdown percentage on pass attempts was 4.4% and his interception rate was 2.2%.
In the 161 games in his career, Cunningham completed 2,429 of 4,289 attempts for a total of 29,979 yards. He totaled 186.2 yds per contest through the air. Cunningham threw for 207 touchdowns while giving up 134 picks. He was driven back 2,904 yds while being sacked 484 different times. His TD percentage was 4.8% and his interception rate was 3.1%.
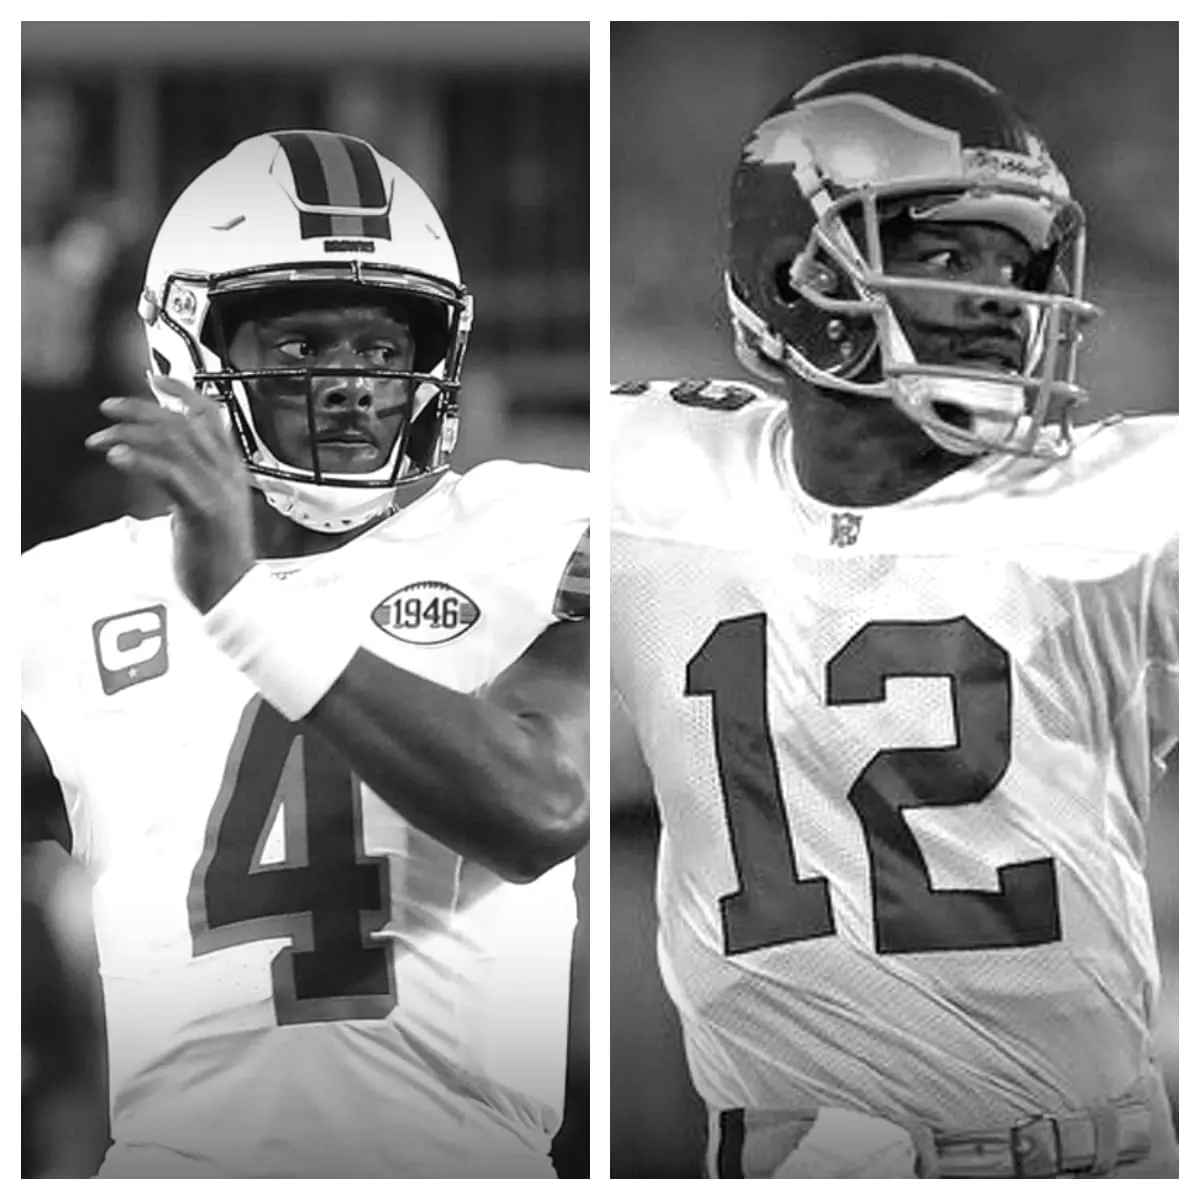
Donovan McNabb vs Randall Cunningham Stats<-h2>
| Donovan McNabb<-th> | Career<-th> | Randall Cunningham<-th><-tr><-thead> |
|---|---|---|
| 167<-td> | Games Played<-td> | 161<-td><-tr> |
| 3,170<-td> | Completions<-td> | 2,429<-td><-tr> |
| 5,374<-td> | Pass Attempts<-td> | 4,289<-td><-tr> |
| 59.0%<-td> | Completion %<-td> | 56.6%<-td><-tr> |
| 37,276<-td> | Passing Yards<-td> | 29,979<-td><-tr> |
| 234<-td> | Passing Touchdowns<-td> | 207<-td><-tr> |
| 4.4%<-td> | Touchdown Percentage<-td> | 4.8%<-td><-tr> |
| 117<-td> | Interceptions<-td> | 134<-td><-tr> |
| 2.2%<-td> | Interception Percentage<-td> | 3.1%<-td><-tr> |
| 6.9<-td> | Yards Per Pass Attempt<-td> | 7.0<-td><-tr> |
| 6.8<-td> | Adjusted Yards Per Pass Attempt<-td> | 6.5<-td><-tr> |
| 11.8<-td> | Yards Per Completion<-td> | 12.3<-td><-tr> |
| 223.2<-td> | Passing Yards Per Game<-td> | 186.2<-td><-tr> |
| 410<-td> | Times Sacked<-td> | 484<-td><-tr> |
| 7.6%<-td> | Sack Percentage<-td> | 11.3%<-td><-tr><-tr><-tbody><-table>
Subscribe
Login
Please login to comment
0 Comments
Oldest
|