With respect to stats per game, Butler holds an average of 4.3 assists and 5.3 boards. He has 1,400 steals, as well as 379 blocks and 3,772 assists. Having collected 3,206 defensive rebounds and 1,441 on the offensive end of the court, Butler is sitting with 4,647 boards in total so far in his NBA career. Holding an effective FG% of 50.3%, he has additionally accounted for 1,196 infractions as well as 1,399 turnovers. Butler has knocked down 4,920 of 5,833 shots at the foul line, which had him sitting at a percentage of 84.3%. By burying 4,463 out of 8,825 two-point shot attempts, he has accumulated an average of 50.6%. By putting in 684 out of 2,084 baskets from distance, he has amassed a 3pt percentage of 32.8%. By putting in 5,147 baskets of his 10,909 tries, Butler has recorded a 47.2% shooting rate. He accounts for 19.9 pts per 36 mins, in addition to pulling down 5.8 rebounds and tallying 4.7 dimes so far in his NBA career. Butler was named a starter in 764 matchups, and in those contests he holds a rate of 18.3 points per contest and has recorded 15,898 points overall. Jimmy Butler has taken part in 869 contests during his career and tallied 28,790 minutes in those matchups.
In reference to sharing the basketball, Jordan has accumulated 5,633 assists, in addition to putting up 2,514 steals and 893 rejections. He averages 6.2 boards in addition to 0.0 assists per game. He has 6,672 rebounds in total so far in his career by way of 5,004 on the defensive side of the court and 1,668 of the offensive sort. With an effective FG% of 50.9%, he has additionally accounted for 2,924 turnovers and tallied 2,783 infractions. Jordan has accounted for a 83.5% clip from the foul line by converting 7,327 of 8,772 attempts. He has accrued a 51.0% 2pt shooting percentage of by burying 11,611 out of his 22,759 attempts. With 1,778 attempts beyond the arc during his NBA career, he has a shooting percentage of 32.7% by making 581 of those shots. Stepping onto the court with a shooting rate of 49.7%, Jordan has converted 12,192 shots of his 24,537 tries. He records 4.9 dimes, pulls in 5.9 boards and scores 28.3 per 36 mins. Jordan has racked up 32,292 points during his pro basketball career, averages 30.1 PPG and started 1,039 matchups. Michael Jordan has compiled 41,011 minutes and has stepped onto the hardwood in 1,072 games so far in his pro basketball career.
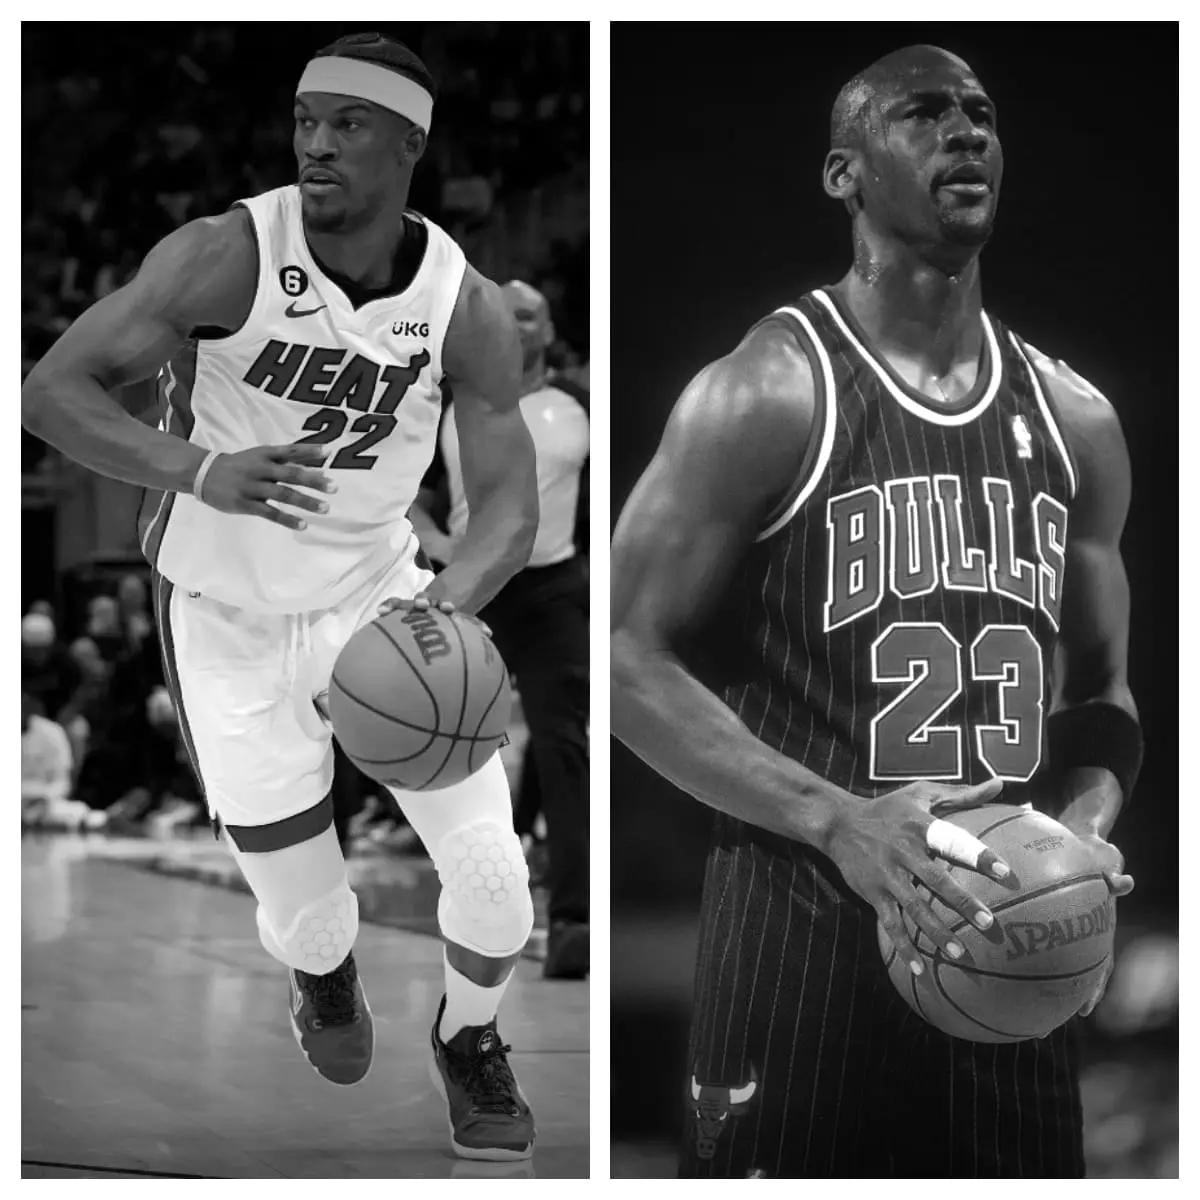
Jimmy Butler vs Michael Jordan Stats
| Jimmy Butler | Career | Michael Jordan |
|---|---|---|
| 869 | Games Played | 1,072 |
| 764 | Games Started | 1,039 |
| 28,790 | Minutes Played | 41,011 |
| 5,147 | Field Goals Made | 12,192 |
| 10,909 | Field Goals Attempted | 24,537 |
| 47.2% | Field Goal Percentage | 49.7% |
| 684 | 3-Pointers Made | 581 |
| 2,084 | 3-Pointers Attempted | 1,778 |
| 32.8% | 3-Point Percentage | 32.7% |
| 4,463 | 2-Pointers Made | 11,611 |
| 8,825 | 2-Pointers Attempted | 22,759 |
| 50.6% | 2-Point Percentage | 51.0% |
| 50.3% | eFG% | 50.9% |
| 4,920 | Free Throws Made | 7,327 |
| 5,833 | Free Throws Attempted | 8,772 |
| 84.3% | Free Throw Percentage | 83.5% |
| 1,441 | Offensive Rebounds | 1,668 |
| 3,206 | Defensive Rebounds | 5,004 |
| 4,647 | Total Rebounds | 6,672 |
| 3,772 | Assists | 5,633 |
| 1,400 | Steals | 2,514 |
| 379 | Blocks | 893 |
| 1,399 | Turnovers | 2,924 |
| 1,196 | Personal Fouls | 2,783 |
| 15,898 | Points Scored | 32,292 |
| 18.3 | Points Per Game | 30.1 |
| 33.1 | Minutes Per Game | 38.3 |
| 4.3 | Assists Per Game | 5.3 |
| 5.3 | Rebounds Per Game | 6.2 |
| 19.9 | Points Per 36 Minutes | 28.3 |
| 5.8 | Rebounds Per 36 Minutes | 5.9 |
| 4.7 | Assists Per 36 Minutes | 4.9 |


