In the 69 contests in his career, Burrow has completed 1,748 of 2,547 attempts for a total of 19,001 yds. He averages 275.4 passing yards per game. Burrow has thrown for 140 touchdowns compared to 46 interceptions. He’s lost 1,176 yards while being sacked 196 different times. His touchdown rate when attempting a pass is 5.5% and his interception percentage is 1.8%.
In the 60 games in his career, Lawrence has connected on 1,288 of his 2,034 attempts for 13,815 yds. He averages 230.3 yards per contest through the air. Lawrence has passed for 69 touchdowns compared to 46 interceptions. He’s lost a combined 672 yds while being sacked 112 different times. His touchdown rate on pass attempts is 3.4% and his interception percentage is 2.3%.
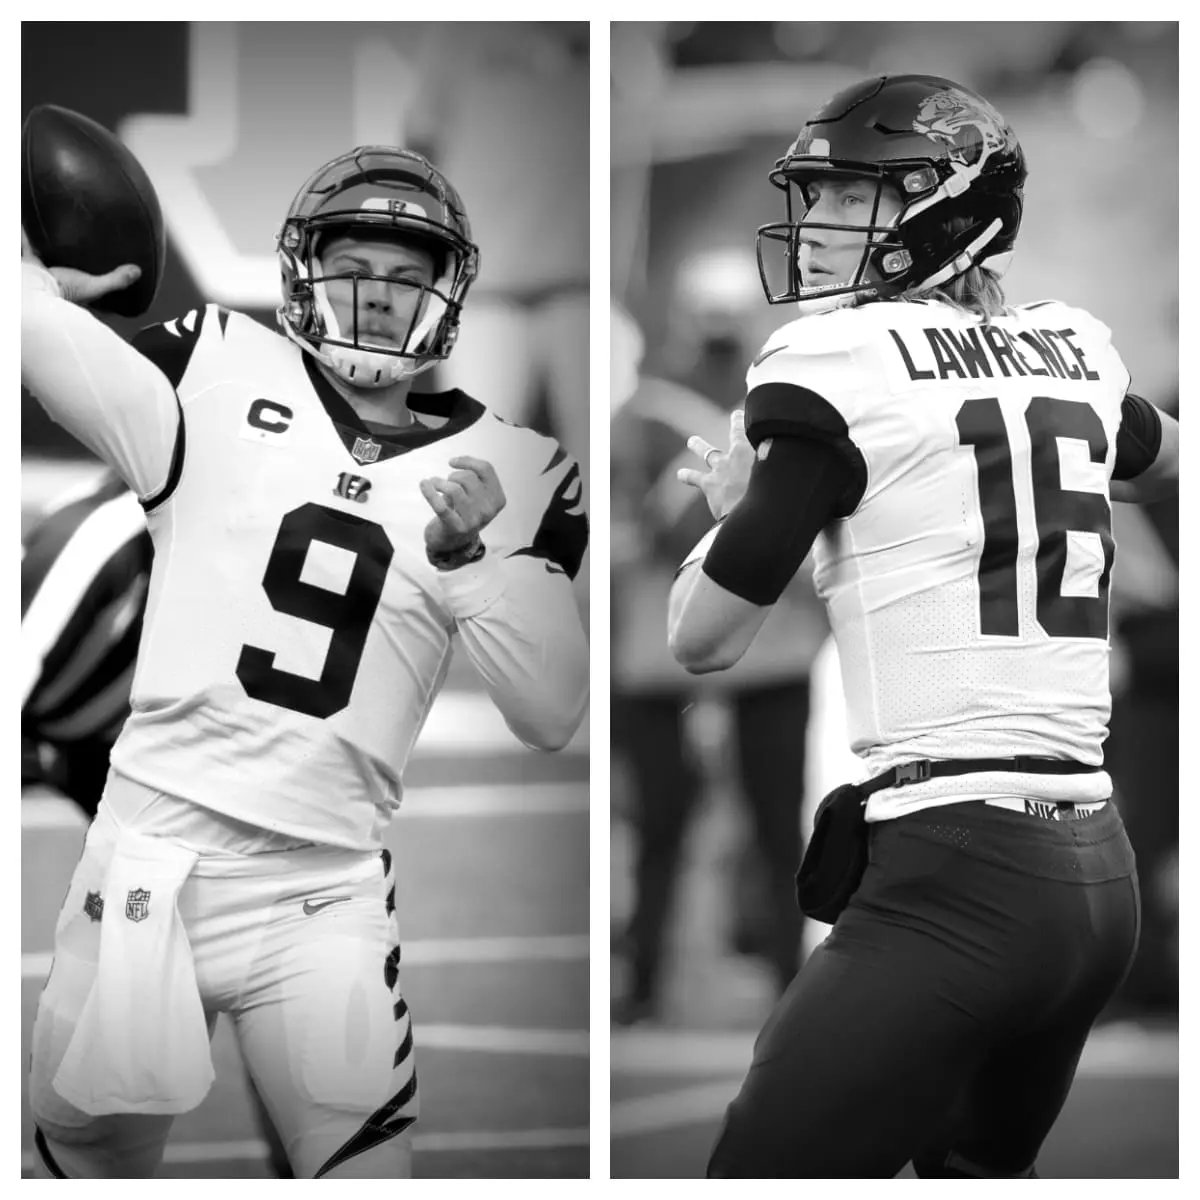
Joe Burrow vs Trevor Lawrence Stats<-h2>
| Joe Burrow<-th> | Career<-th> | Trevor Lawrence<-th><-tr><-thead> |
|---|---|---|
| 69<-td> | Games Played<-td> | 60<-td><-tr> |
| 1,748<-td> | Completions<-td> | 1,288<-td><-tr> |
| 2,547<-td> | Pass Attempts<-td> | 2,034<-td><-tr> |
| 68.6%<-td> | Completion %<-td> | 63.3%<-td><-tr> |
| 19,001<-td> | Passing Yards<-td> | 13,815<-td><-tr> |
| 140<-td> | Passing Touchdowns<-td> | 69<-td><-tr> |
| 5.5%<-td> | Touchdown Percentage<-td> | 3.4%<-td><-tr> |
| 46<-td> | Interceptions<-td> | 46<-td><-tr> |
| 1.8%<-td> | Interception Percentage<-td> | 2.3%<-td><-tr> |
| 7.5<-td> | Yards Per Pass Attempt<-td> | 6.8<-td><-tr> |
| 7.7<-td> | Adjusted Yards Per Pass Attempt<-td> | 6.5<-td><-tr> |
| 10.9<-td> | Yards Per Completion<-td> | 10.7<-td><-tr> |
| 275.4<-td> | Passing Yards Per Game<-td> | 230.3<-td><-tr> |
| 196<-td> | Times Sacked<-td> | 112<-td><-tr> |
| 7.7%<-td> | Sack Percentage<-td> | 5.5%<-td><-tr><-tr><-tbody><-table>
Related |