Jacobs is running for 76.4 yards on the ground per contest in his career. He has run for 61 TD’s. His average when carrying the ball sits at 4.3 and he’s carried it 1,606 total times. Josh Jacobs has accumulated 6,874 yards carrying the ball in 90 games played in his career.
So far in his career, Chubb has laced them up in 85 games and has gained 6,843 yds on the ground. He’s carried the ball 1,340 different times for an average of 5.1 yards per attempt. He’s gaining 80.5 yards per contest and has scored 51 times while carrying the ball. Chubb has coughed up the ball 1 time in his career.
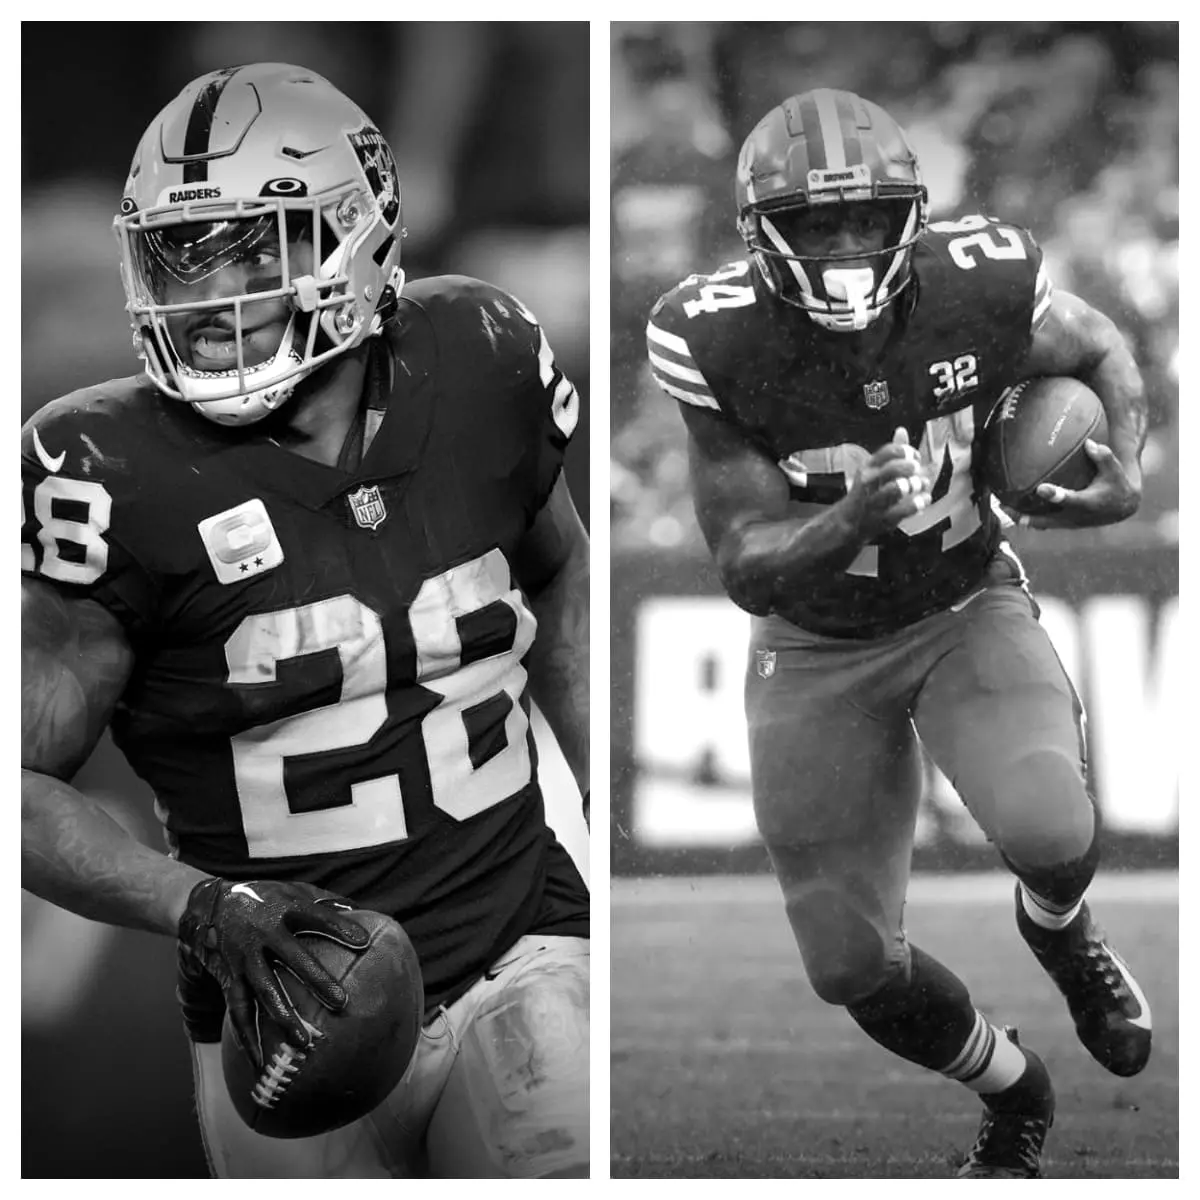
Josh Jacobs vs Nick Chubb Stats<-h2>
| Josh Jacobs<-th> | Career<-th> | Nick Chubb<-th><-tr><-thead> |
|---|---|---|
| 90<-td> | Games Played<-td> | 85<-td><-tr> |
| 1,606<-td> | Rushing Attempts<-td> | 1,340<-td><-tr> |
| 6,874<-td> | Rushing Yards<-td> | 6,843<-td><-tr> |
| 61<-td> | Rushing TD<-td> | 51<-td><-tr> |
| 359<-td> | 1st Downs by Rushing<-td> | 320<-td><-tr> |
| 0<-td> | Longest Run<-td> | 0<-td><-tr> |
| 4.3<-td> | Yards Per Carry<-td> | 5.1<-td><-tr> |
| 76.4<-td> | Rushing Yards Per Game<-td> | 80.5<-td><-tr> |
| 4<-td> | Fumbles<-td> | 1<-td><-tr> |