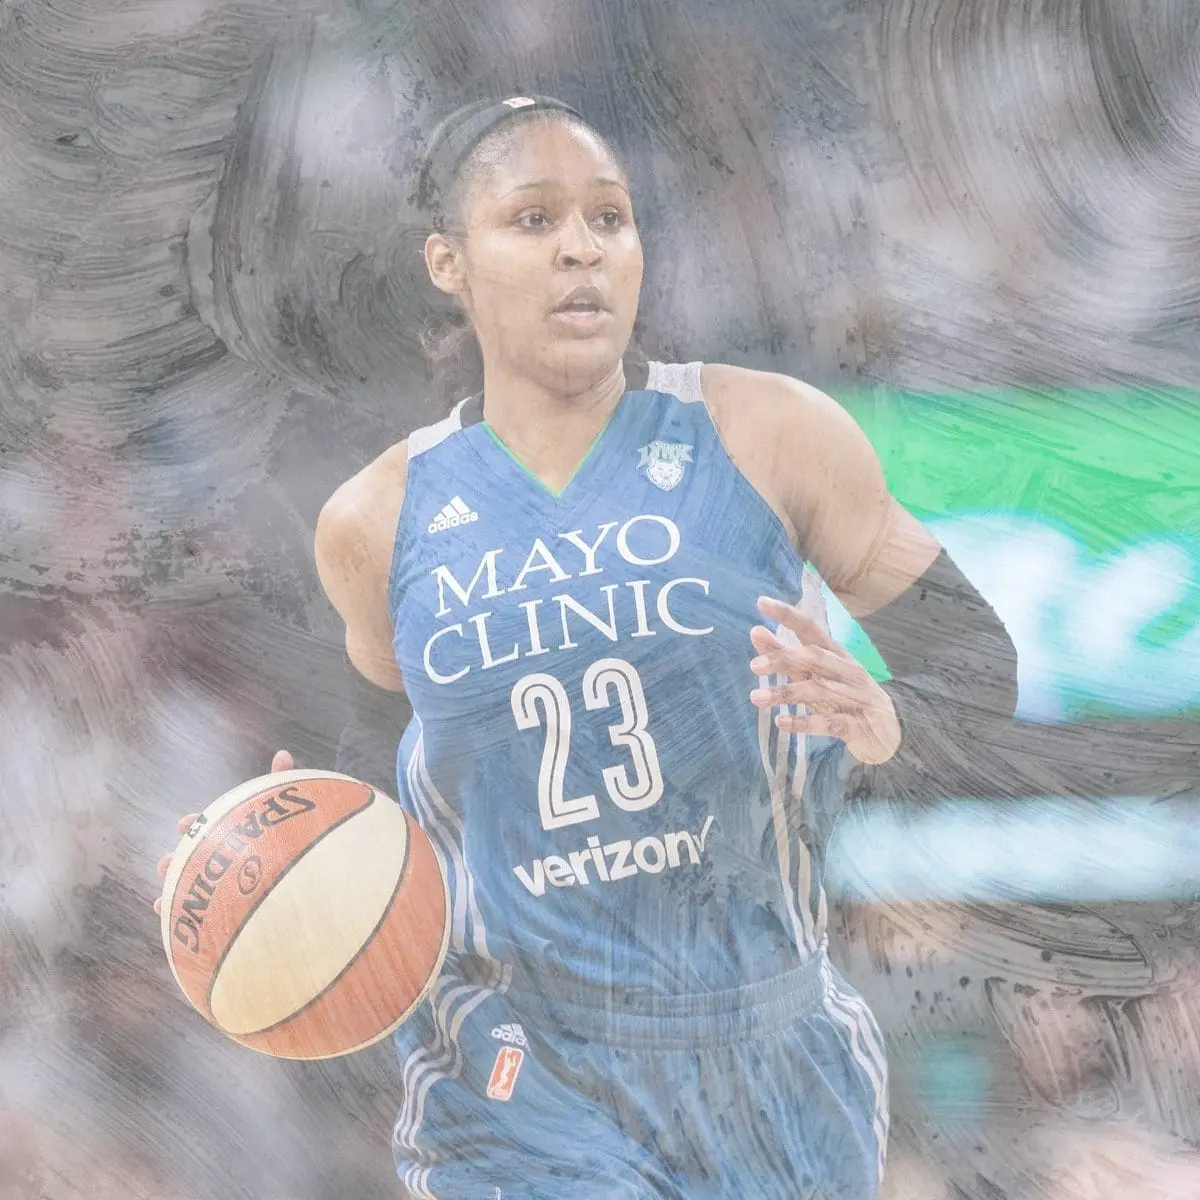
In the matter of stats per game, Moore comes in with an average of 3.3 assists as well as 5.9 rebounds. She has earned 451 steals, in addition to 176 rejections and 895 assists. Having pulled down 1,127 defensive rebounds and 462 on the offensive end, Moore has earned 1,589 boards in total so far in her WNBA career. Having earned an effective FG percentage of 52.1%, she has additionally garnered 686 fouls as well as 528 turnovers. Moore has buried 890 out of 1,035 tries from the foul line, which had her earning a rate of 86.0%. By burying 1,252 out of her 2,551 2pt attempts, she has a rate of 49.1%. By knocking down 530 of her 1,381 shots from 3-point range, she has earned a three-point shooting percentage of 38.4%. By burying 1,782 baskets of her 3,932 attempts, Moore has a 45.3% shooting percentage. She accounts for 21.2 points per 36 mins, in addition to snagging 6.8 boards and earning 3.8 dimes thus far in her career. Moore has started in 271 matchups, and in those contests she averages 18.4 points per game and has amassed 4,984 points in total. Maya Moore has participated in 271 contests so far in her career and is sitting with 8,466 minutes in those contests.
Maya Moore Stats
| Year | Team | Pts | Reb | Ast | Stl | Blk | G | Min | FG | FG% | 3P% | 2P% | FT% | PPG | APG | RPG | SPG |
|---|---|---|---|---|---|---|---|---|---|---|---|---|---|---|---|---|---|
| Career | 4,984 | 1,589 | 895 | 451 | 176 | 271 | 8,466 | 1,782 | 45.3% | 38.4% | 49.1% | 86.0% | 18.4 | 3.3 | 5.9 | 1.7 | |
| 2018 | MIN | 612 | 174 | 88 | 57 | 12 | 34 | 1,081 | 223 | 42.3% | 36.5% | 45.4% | 83.3% | 18.0 | 2.6 | 5.1 | 1.7 |
| 2017 | MIN | 588 | 171 | 119 | 64 | 14 | 34 | 1,063 | 207 | 44.2% | 41.1% | 45.8% | 85.8% | 17.3 | 3.5 | 5.0 | 1.9 |
| 2016 | MIN | 656 | 175 | 142 | 53 | 25 | 34 | 1,009 | 223 | 44.8% | 40.4% | 46.9% | 86.8% | 19.3 | 4.2 | 5.1 | 1.6 |
| 2015 | MIN | 681 | 222 | 115 | 56 | 26 | 33 | 1,102 | 238 | 42.0% | 35.9% | 45.2% | 85.5% | 20.6 | 3.5 | 6.7 | 1.7 |
| 2014 | MIN | 812 | 275 | 116 | 64 | 28 | 34 | 1,181 | 295 | 48.1% | 33.5% | 54.4% | 88.4% | 23.9 | 3.4 | 8.1 | 1.9 |
| 2013 | MIN | 628 | 210 | 101 | 59 | 33 | 34 | 1,068 | 233 | 50.9% | 45.3% | 53.8% | 88.2% | 18.5 | 3.0 | 6.2 | 1.7 |
| 2012 | MIN | 558 | 205 | 124 | 50 | 22 | 34 | 1,011 | 199 | 46.5% | 38.8% | 52.5% | 87.9% | 16.4 | 3.6 | 6.0 | 1.5 |
| 2011 | MIN | 449 | 157 | 90 | 48 | 16 | 34 | 951 | 164 | 43.9% | 36.9% | 48.8% | 78.8% | 13.2 | 2.6 | 4.6 | 1.4 |
2018 Stats for Maya Moore
| Stat | Total | WNBA Rank |
|---|---|---|
| Games | 34 | 19th |
| Games Started | 34 | 10th |
| Minutes Played | 1,081 | 8th |
| Field Goals Made | 223 | 1196th |
| Field Goals Attempted | 527 | 3rd |
| Field Goal Percentage | 42.3% | 85th |
| 3-Pointers Made | 66 | 7th |
| 3-Pointers Attempted | 181 | 6th |
| 3-Point Percentage | 36.5% | 39th |
| 2-Point Field Goals Made | 157 | 12th |
| 2-Point Field Goals Attempted | 346 | 8th |
| 2-Point Field Goal Percentage | 45.4% | 89th |
| Free Throws Made | 100 | 15th |
| Free Throws Attempted | 120 | 16th |
| Free Throw Percentage | 83.3% | 61st |
| Offensive Rebounds | 47 | 20th |
| Total Rebounds | 174 | 23rd |
| Assists | 88 | 29th |
| Steals | 57 | 1st |
| Blocks | 12 | 32nd |
| Turnovers | 60 | 22nd |
| Personal Fouls | 62 | 50th |
| Points Scored | 612 | 7th |
| Points Per Game | 18.0 | 1194th |
| Rebounds Per Game | 5.1 | 1176th |
| Assists Per Game | 2.6 | 1164th |
| Steals Per Game | 1.7 | 1201st |
| Blocks Per Game | 0.4 | 1159th |
0