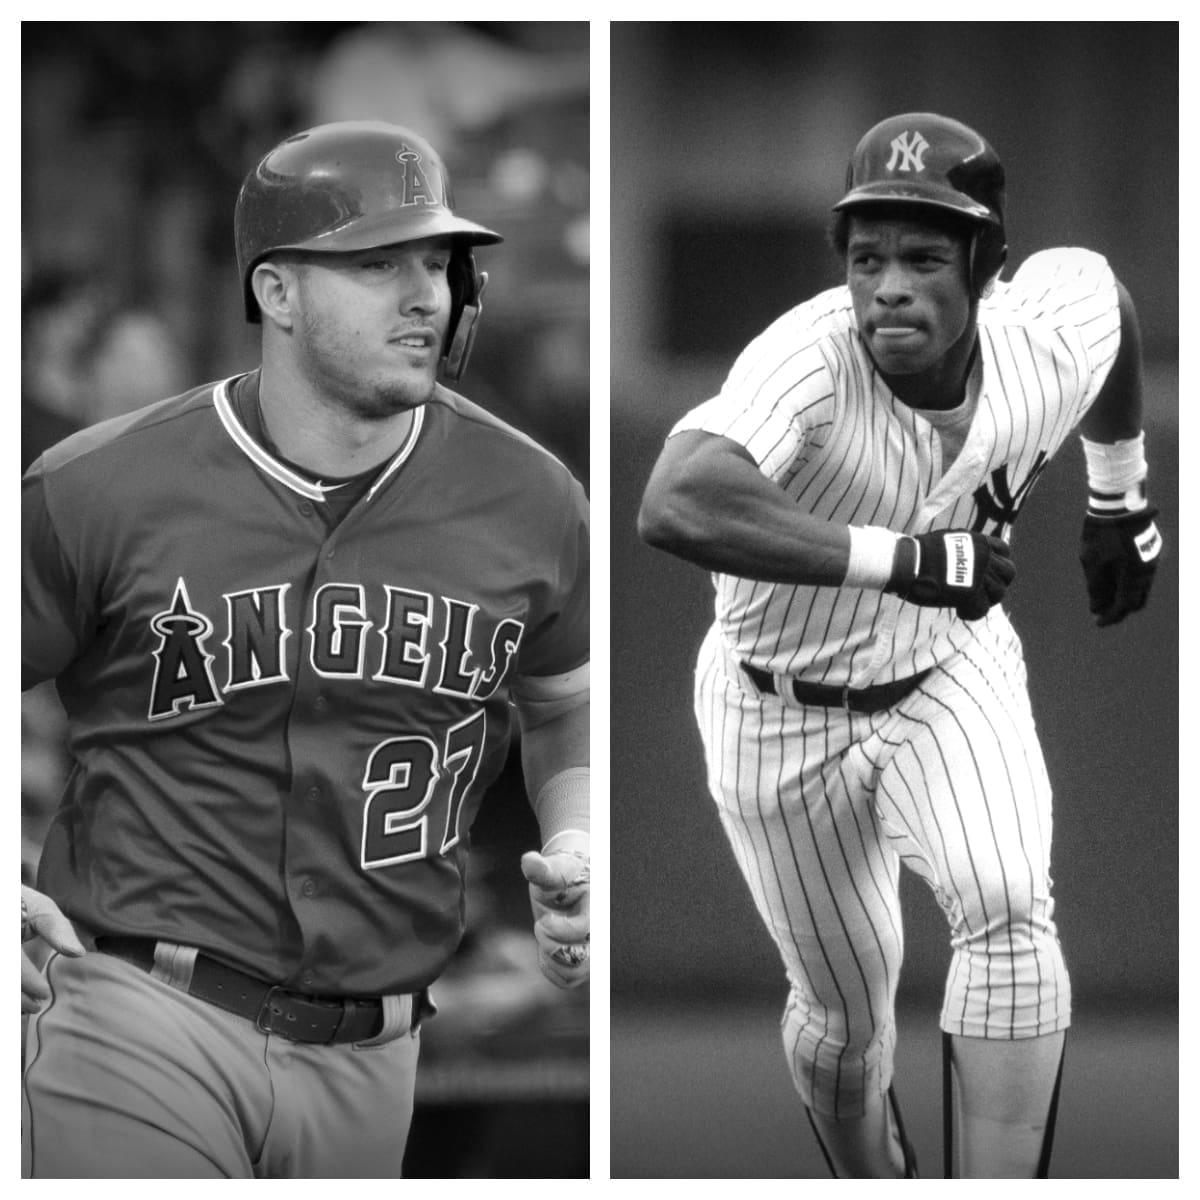
Trout has compiled an average at the plate of .294 in his time in baseball with 1,190 scored runs and an OPS of .975. He has gone down on strikes 1,656 times and earned a walk on 1,065 attempts at the plate, which has contributed to a .407 on-base %. For his MLB career, Trout has drilled 400 baseballs over the fence while driving in 1,013 runs. He has compiled a slugging percentage of .569 and he has a total of 3,382 bases. In his time in the Majors, he came to the plate 7,182 times and came through with a base hit 1,748 times.
In the 10,961 at-bats in his career, Henderson has accumulated a batting average of .279 in addition to having 3,055 base hits. He has homered 297 times, with 4,588 bases in total and a .046 slugging percentage. Henderson has tallied a free base 2,190 times while fanning on 1,694 tries. He has scored 2,295 runs in addition to having 1,115 RBIs. His OBP sits at .401 and he also has a career OPS of .447.
| Mike Trout | Career | Rickey Henderson |
|---|---|---|
| 1,642 | Games Played | 3,081 |
| 7,182 | Plate Appearances | 13,346 |
| 5,948 | At-Bats | 10,961 |
| 1,190 | Runs | 2,295 |
| 1,748 | Hits | 3,055 |
| 324 | Doubles | 510 |
| 55 | Triples | 66 |
| 400 | Home Runs | 297 |
| 1,013 | Runs Batted In | 1,115 |
| 214 | Stolen Bases | 1,406 |
| 38 | Caught Stealing | 335 |
| 1,065 | Walks | 2,190 |
| 1,656 | Strikeouts | 1,694 |
| .294 | Batting Average | .279 |
| .407 | On-Base Percentage | .401 |
| .569 | Slugging Percentage | .046 |
| 0.975 | OPS | 0.447 |
| 3,382 | Total Bases | 4,588 |
| 75 | Grounded Into Double Plays | 172 |
| 106 | Hit By Pitch | 98 |