Jones is running for 62.1 yards on the ground per game thus far in his career. He’s run for 50 touchdowns. His average when carrying the ball is 4.9 and he’s carried it 1,432 total times. Aaron Jones has run for 7,078 yards on the ground in 114 games played in his career.
To this point in his career, Mixon has taken the field in 111 games and has accumulated 7,428 yards carrying the ball. He has been handed the ball 1,816 different times for an average of 4.1 yards per attempt. He is averaging 66.9 yards per contest and has scored 60 times while carrying the ball. Mixon has fumbled the ball 0 times in his career.
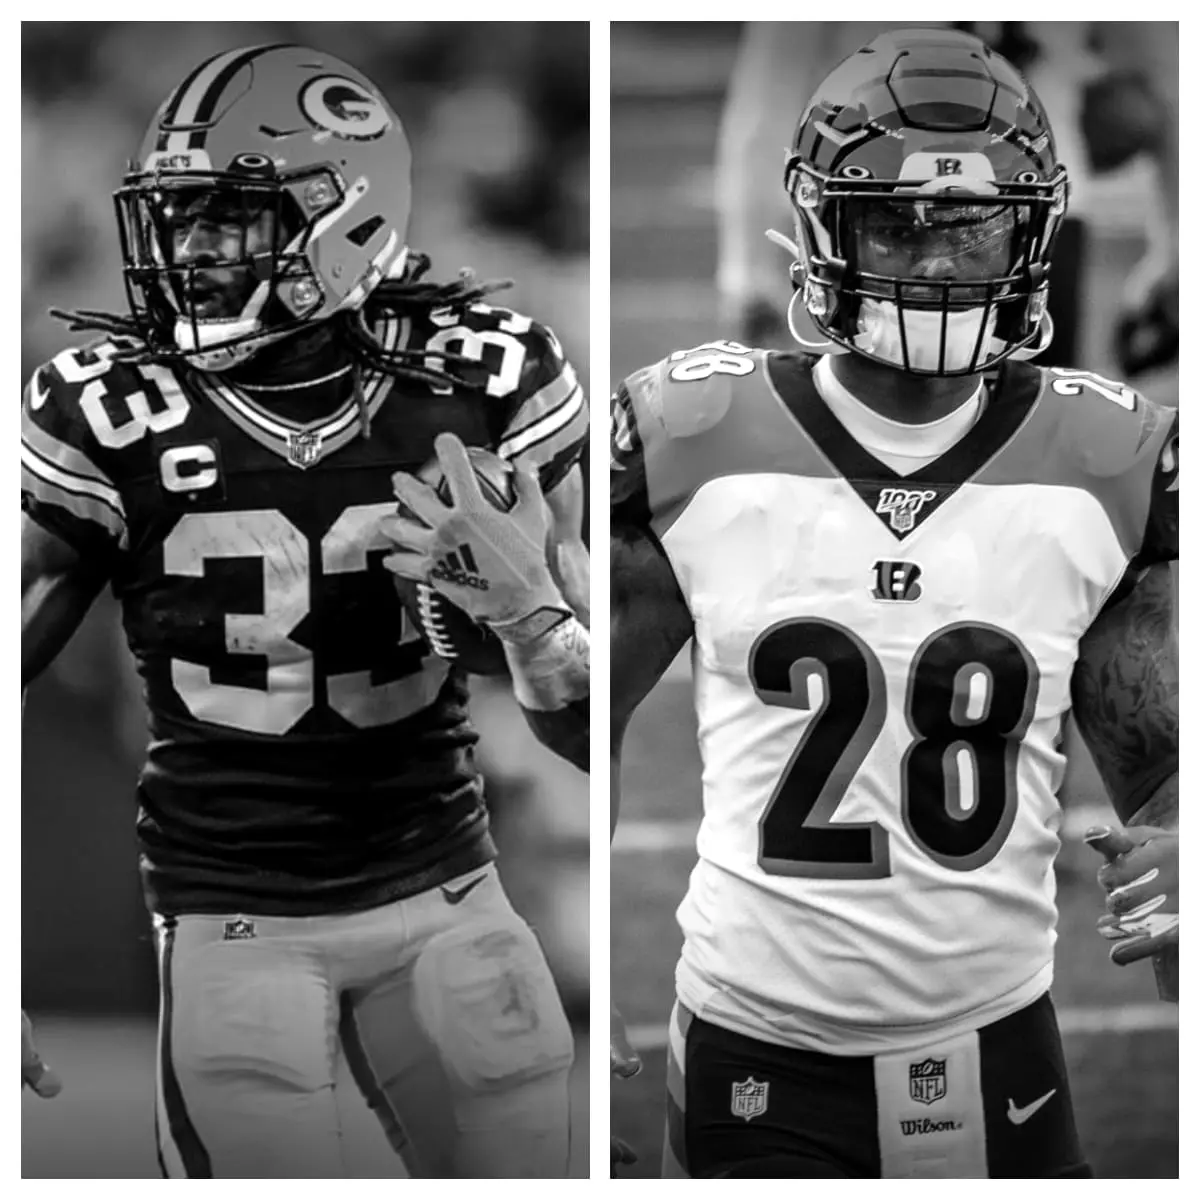
Aaron Jones vs Joe Mixon Stats<-h2>
| Aaron Jones<-th> | Career<-th> | Joe Mixon<-th><-tr><-thead> |
|---|---|---|
| 114<-td> | Games Played<-td> | 111<-td><-tr> |
| 1,432<-td> | Rushing Attempts<-td> | 1,816<-td><-tr> |
| 7,078<-td> | Rushing Yards<-td> | 7,428<-td><-tr> |
| 50<-td> | Rushing TD<-td> | 60<-td><-tr> |
| 345<-td> | 1st Downs by Rushing<-td> | 393<-td><-tr> |
| 0<-td> | Longest Run<-td> | 0<-td><-tr> |
| 4.9<-td> | Yards Per Carry<-td> | 4.1<-td><-tr> |
| 62.1<-td> | Rushing Yards Per Game<-td> | 66.9<-td><-tr> |
| 5<-td> | Fumbles<-td> | 0<-td><-tr> |