In the 236 contests in his career, Manning connected on 4,895 of his 8,119 attempts for a total of 57,023 yds. He finished with 241.6 yds per contest through the air. Manning threw for 366 TD’s compared to 244 interceptions. He was driven back 2,466 yds while being sacked 411 times. His touchdown rate on pass attempts was 4.5% and his interception percentage was 3.0%.
In 140 games in his career, Namath completed 1,886 of his 3,762 attempts for a total of 27,663 yards. He averaged 197.6 yds per game through the air. Namath threw for 173 TD’s compared to 220 interceptions. He was driven back 1,020 yards while being the victim of a QB sack 170 times. His TD rate on pass attempts was 4.6% and his interception percentage was 5.8%.
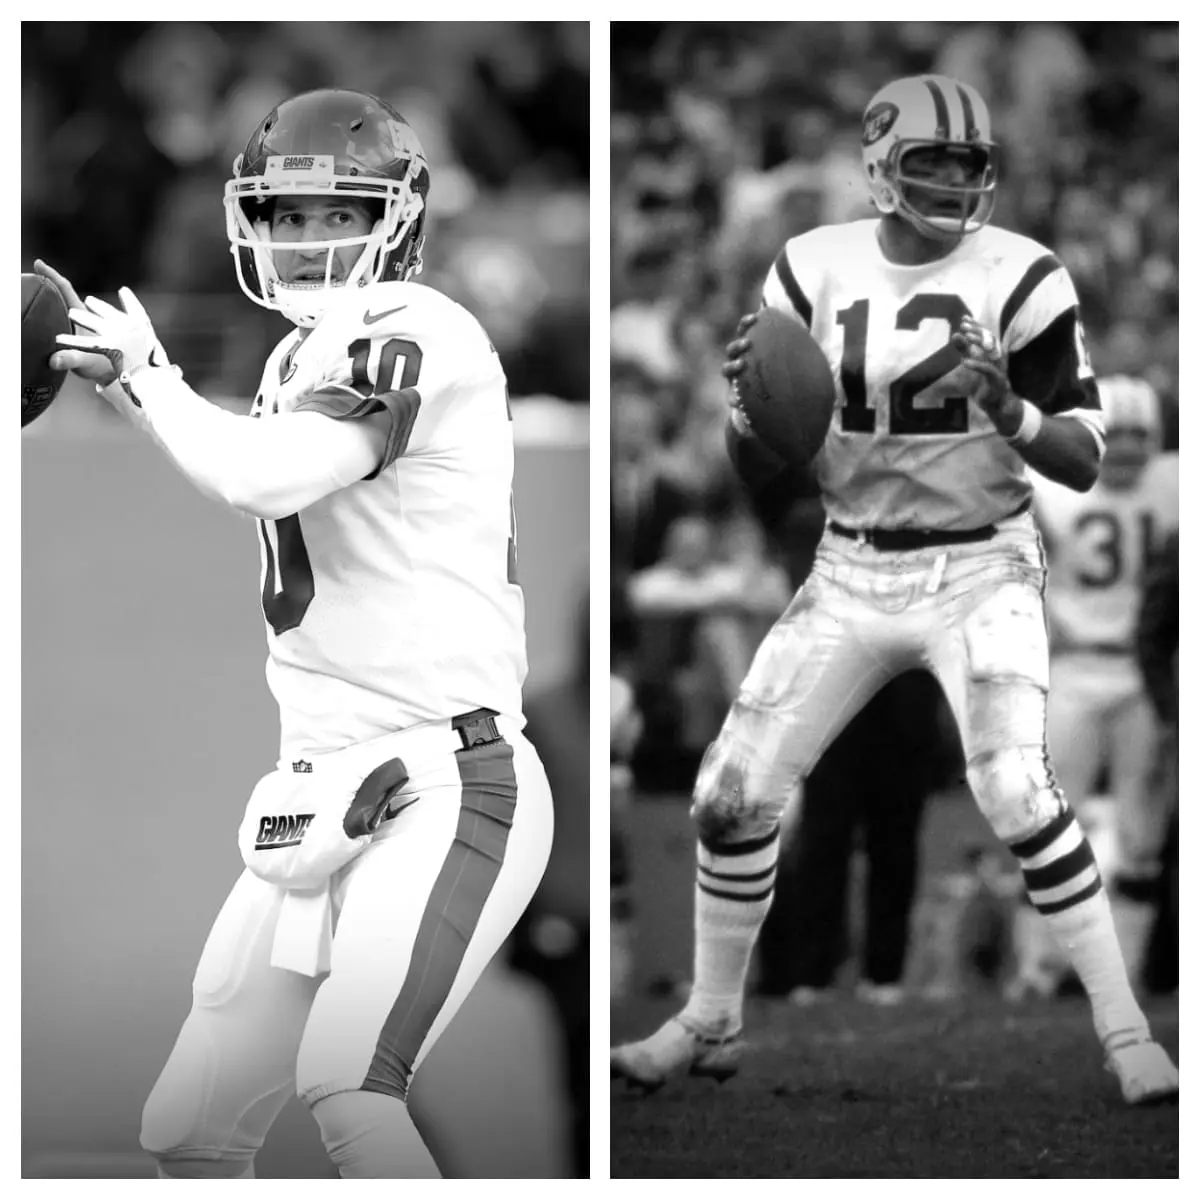
Eli Manning vs Joe Namath Stats<-h2>
| Eli Manning<-th> | Career<-th> | Joe Namath<-th><-tr><-thead> |
|---|---|---|
| 236<-td> | Games Played<-td> | 140<-td><-tr> |
| 4,895<-td> | Completions<-td> | 1,886<-td><-tr> |
| 8,119<-td> | Pass Attempts<-td> | 3,762<-td><-tr> |
| 60.3%<-td> | Completion %<-td> | 50.1%<-td><-tr> |
| 57,023<-td> | Passing Yards<-td> | 27,663<-td><-tr> |
| 366<-td> | Passing Touchdowns<-td> | 173<-td><-tr> |
| 4.5%<-td> | Touchdown Percentage<-td> | 4.6%<-td><-tr> |
| 244<-td> | Interceptions<-td> | 220<-td><-tr> |
| 3.0%<-td> | Interception Percentage<-td> | 5.8%<-td><-tr> |
| 7.0<-td> | Yards Per Pass Attempt<-td> | 7.4<-td><-tr> |
| 6.6<-td> | Adjusted Yards Per Pass Attempt<-td> | 5.6<-td><-tr> |
| 11.6<-td> | Yards Per Completion<-td> | 14.7<-td><-tr> |
| 241.6<-td> | Passing Yards Per Game<-td> | 197.6<-td><-tr> |
| 411<-td> | Times Sacked<-td> | 170<-td><-tr> |
| 5.1%<-td> | Sack Percentage<-td> | 4.5%<-td><-tr><-tr><-tbody><-table>
Subscribe
Login
Please login to comment
0 Comments
Oldest
|